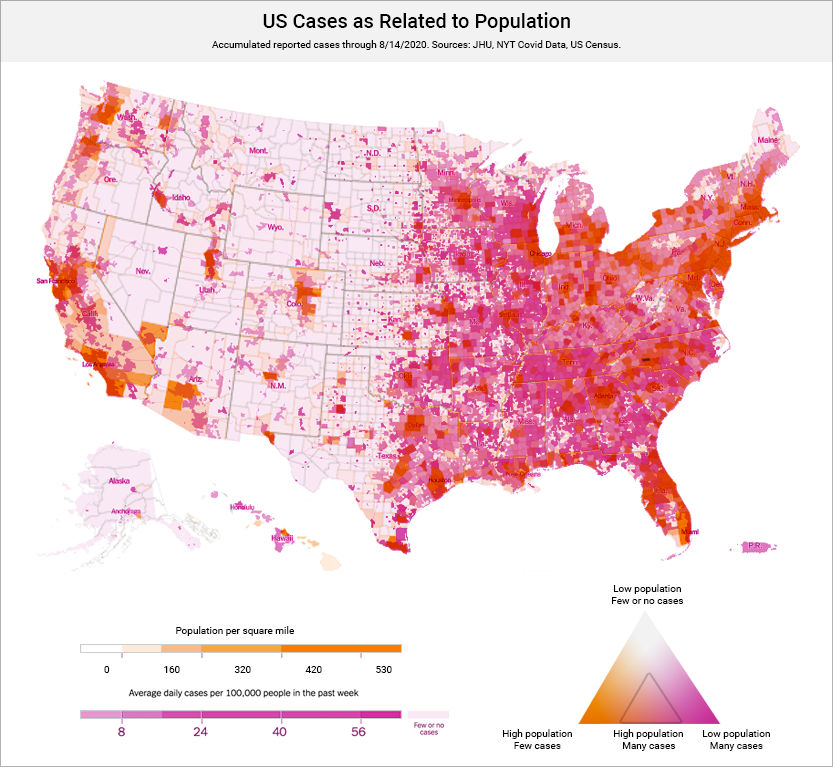
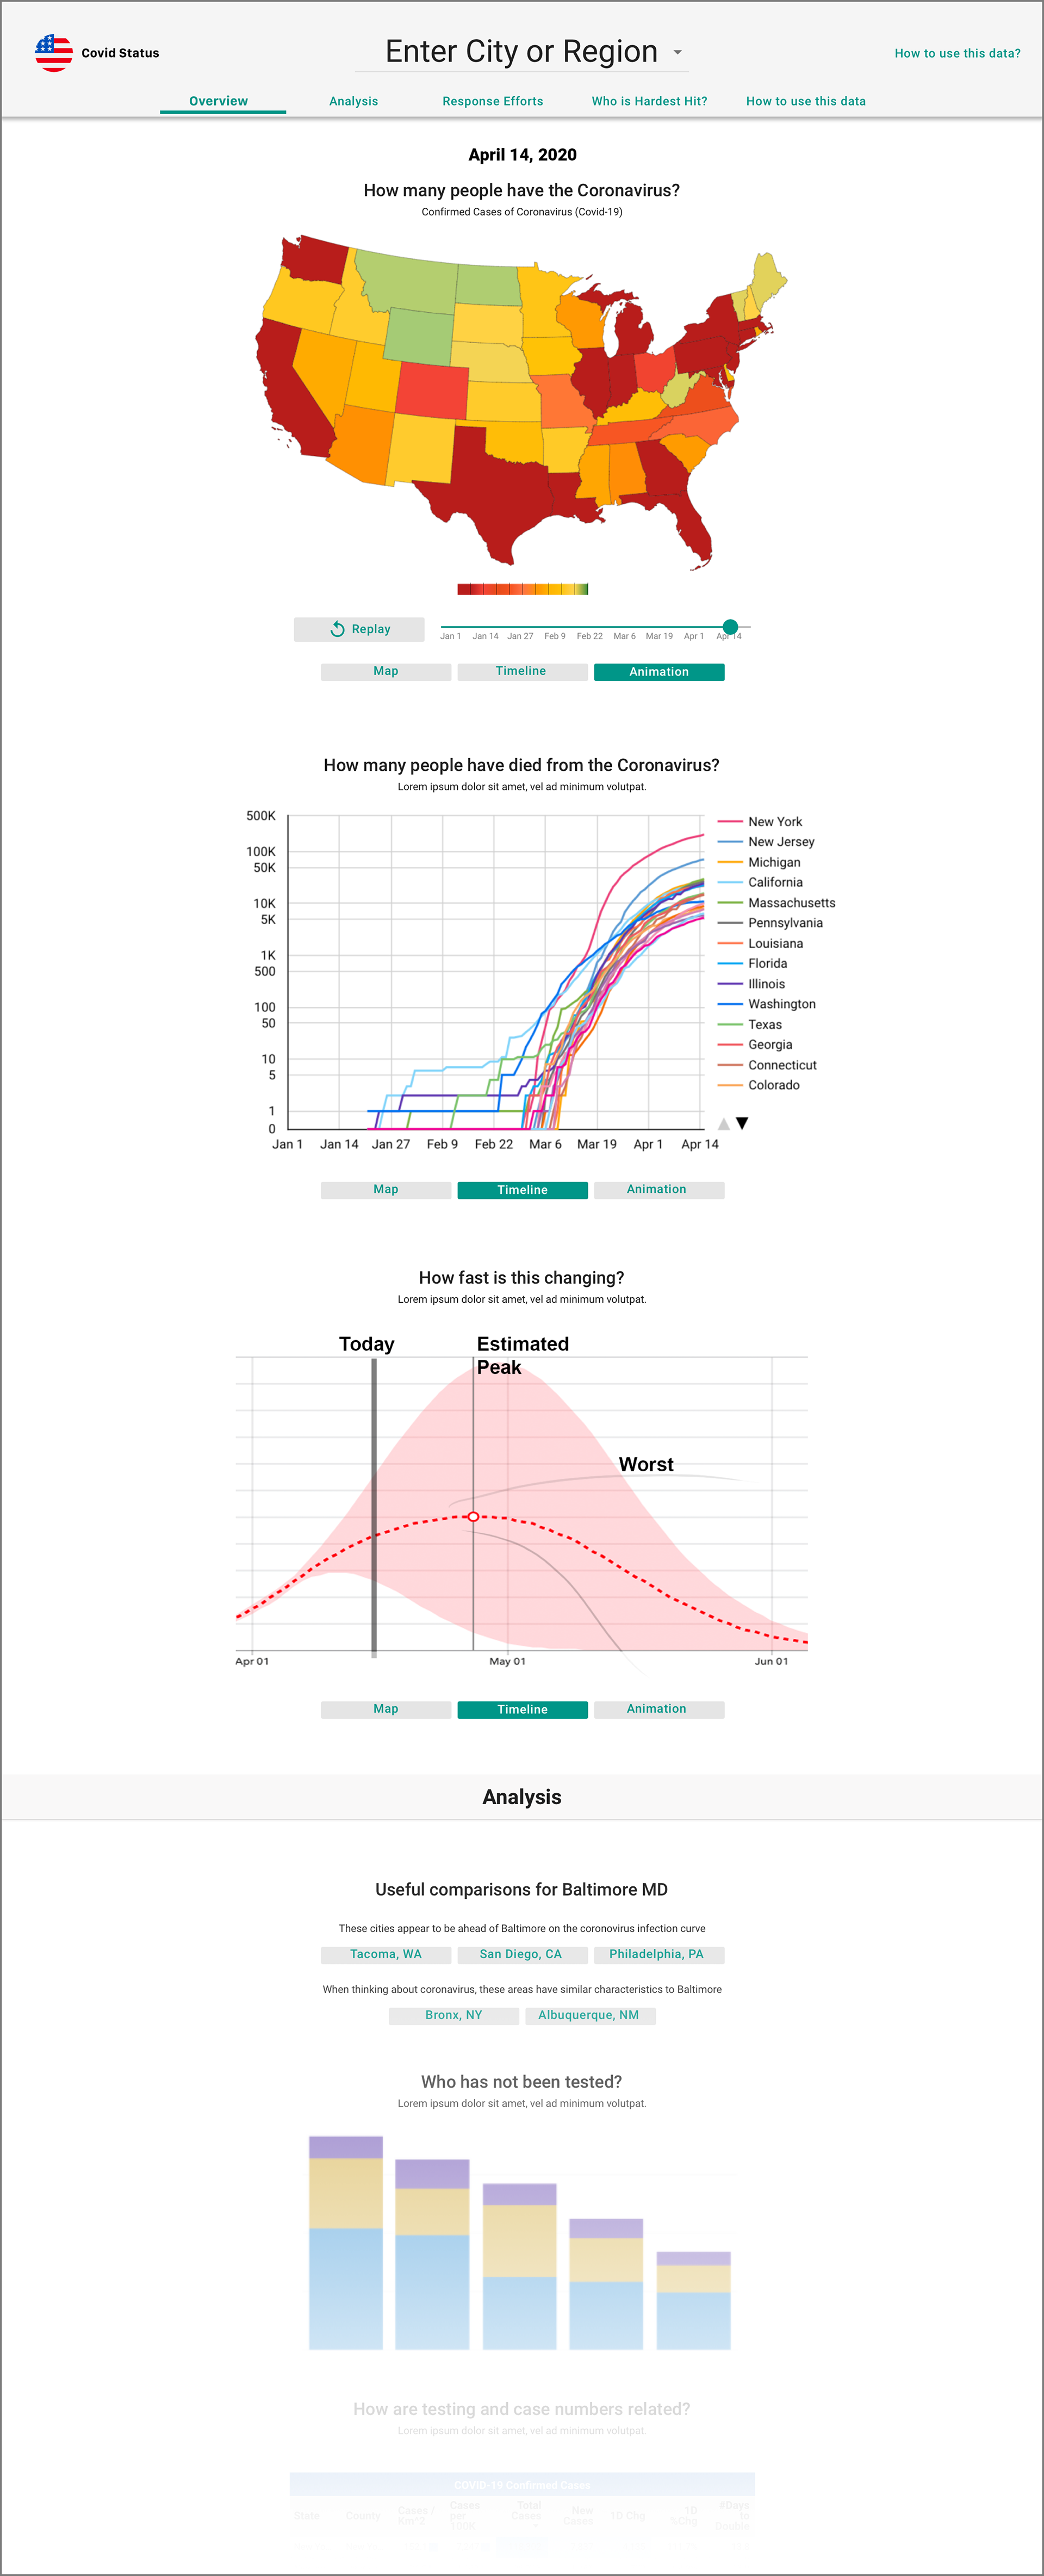
Rapid-Design for Covid Dashboards
Visually balancing multiple data sets to surface life-saving insights to a nation and planet under adversity. Client: Hawkfish / Bloomberg
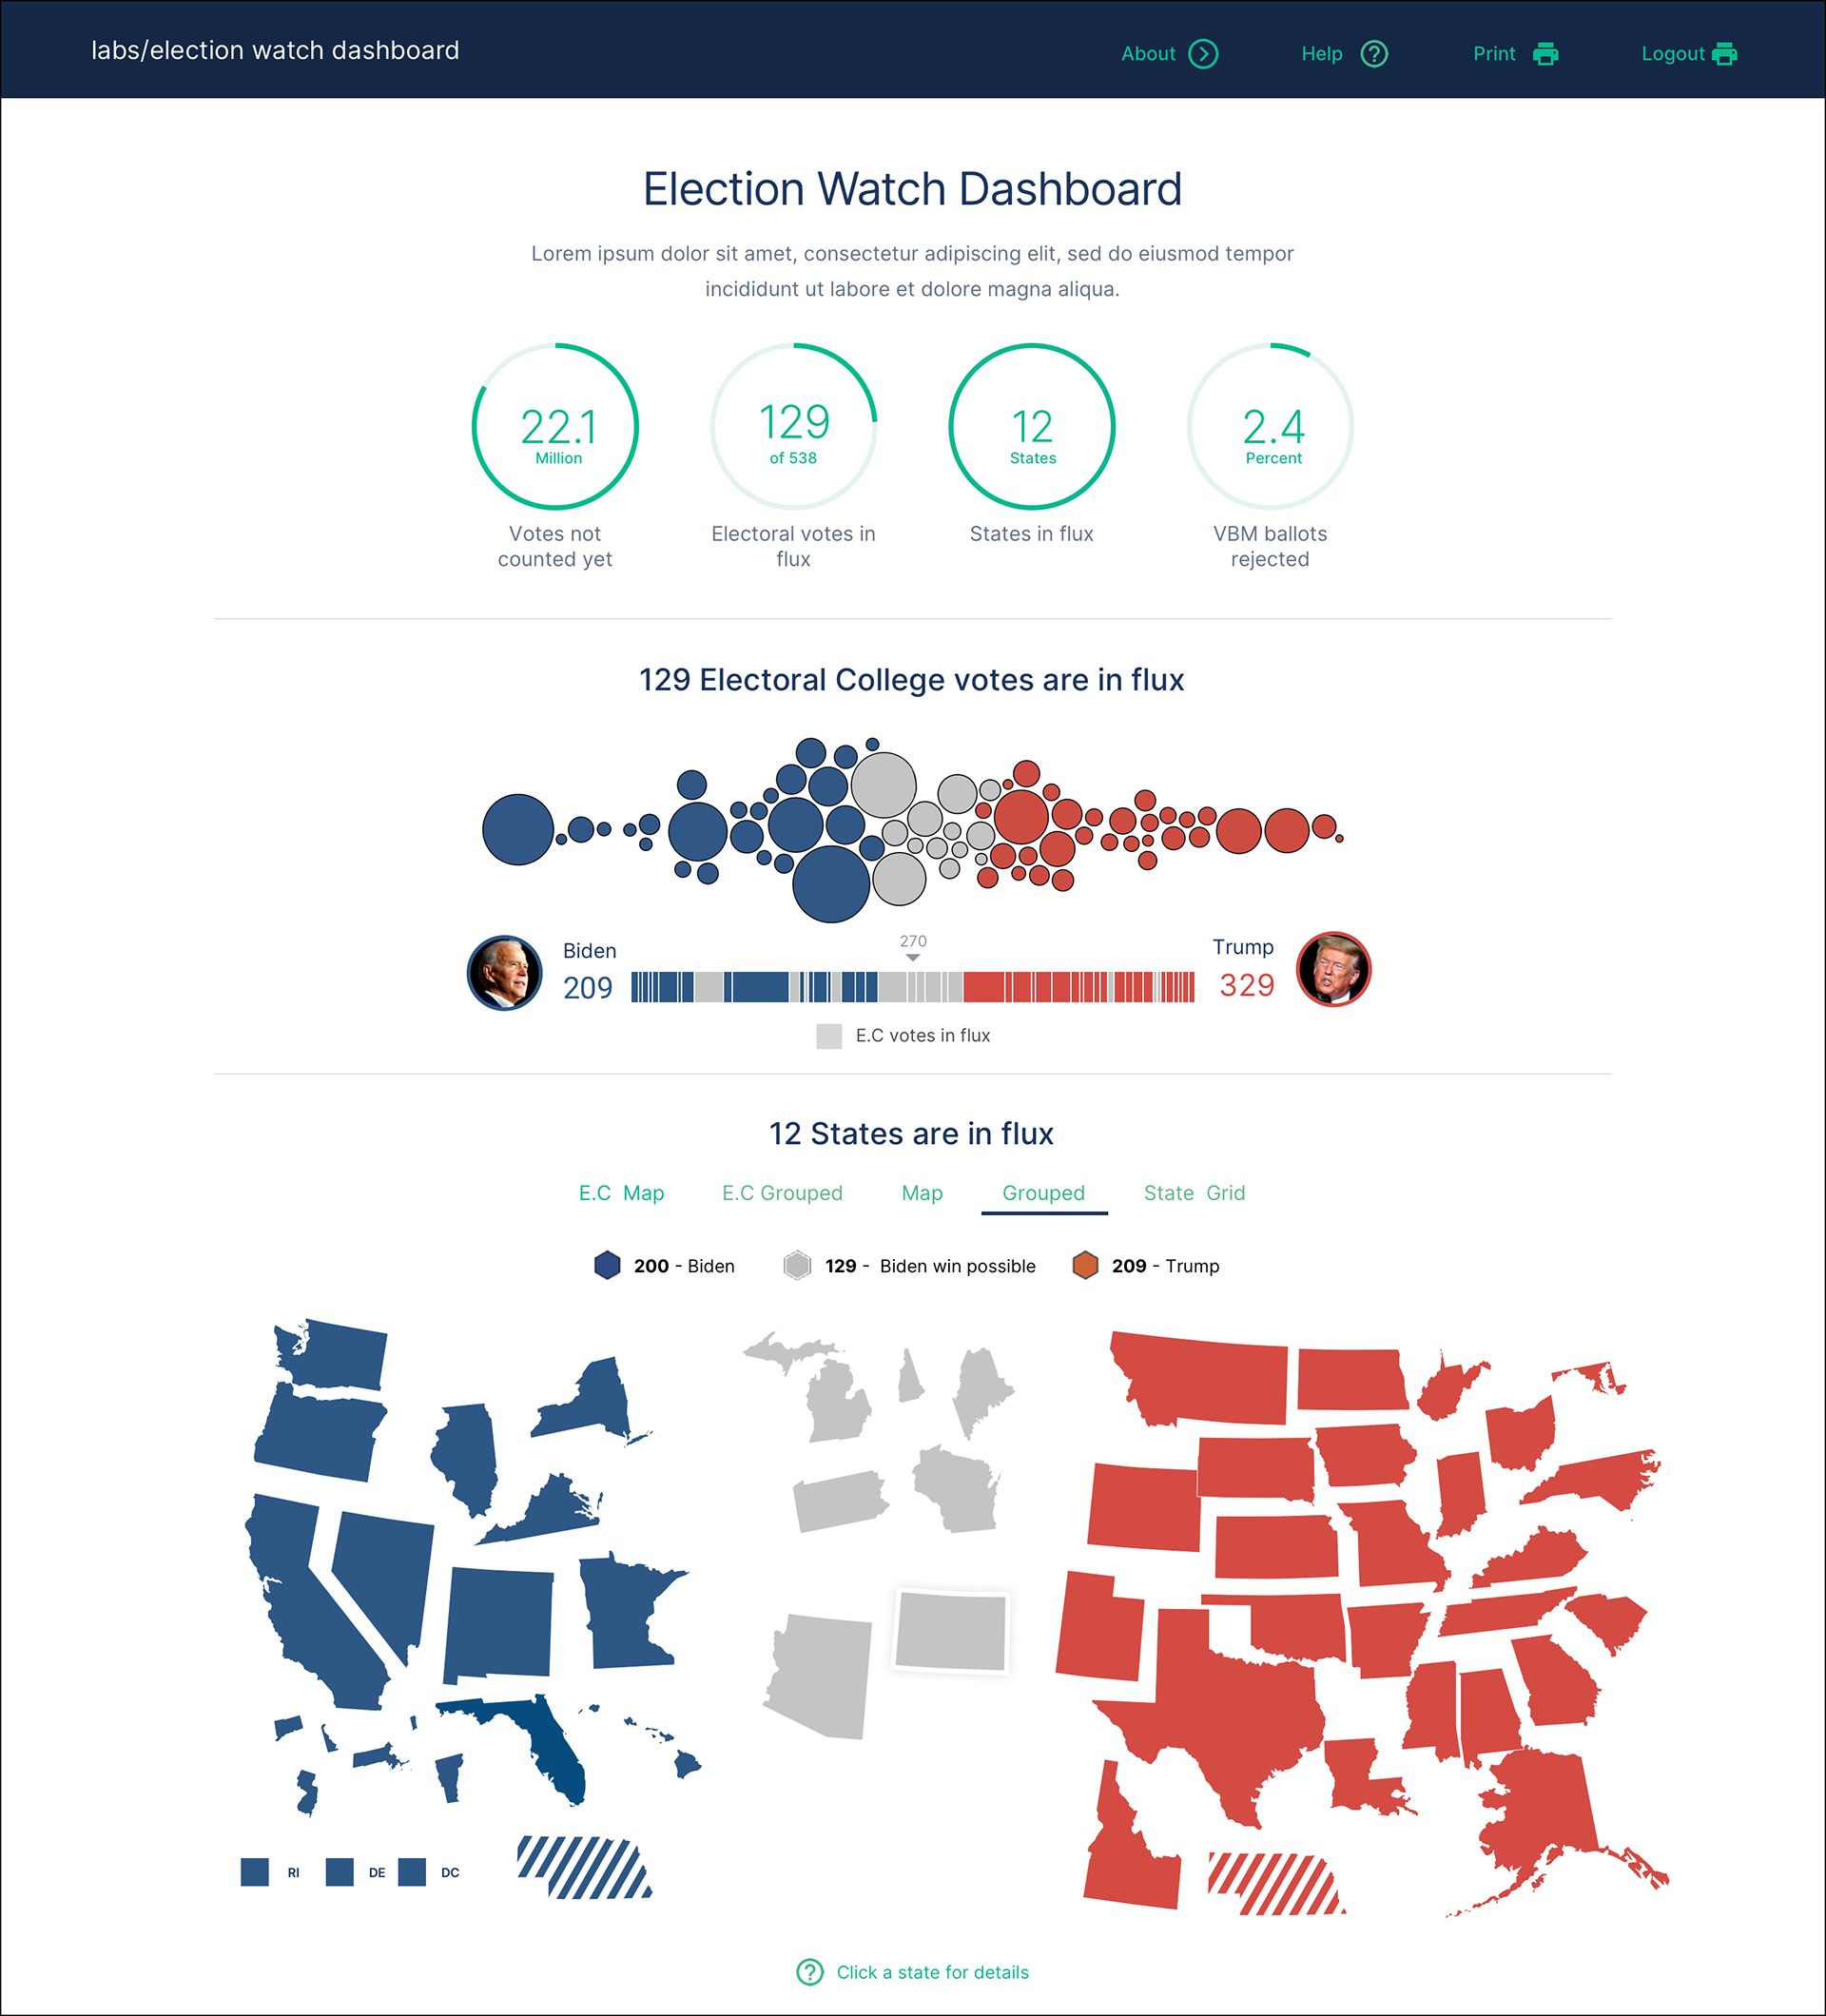
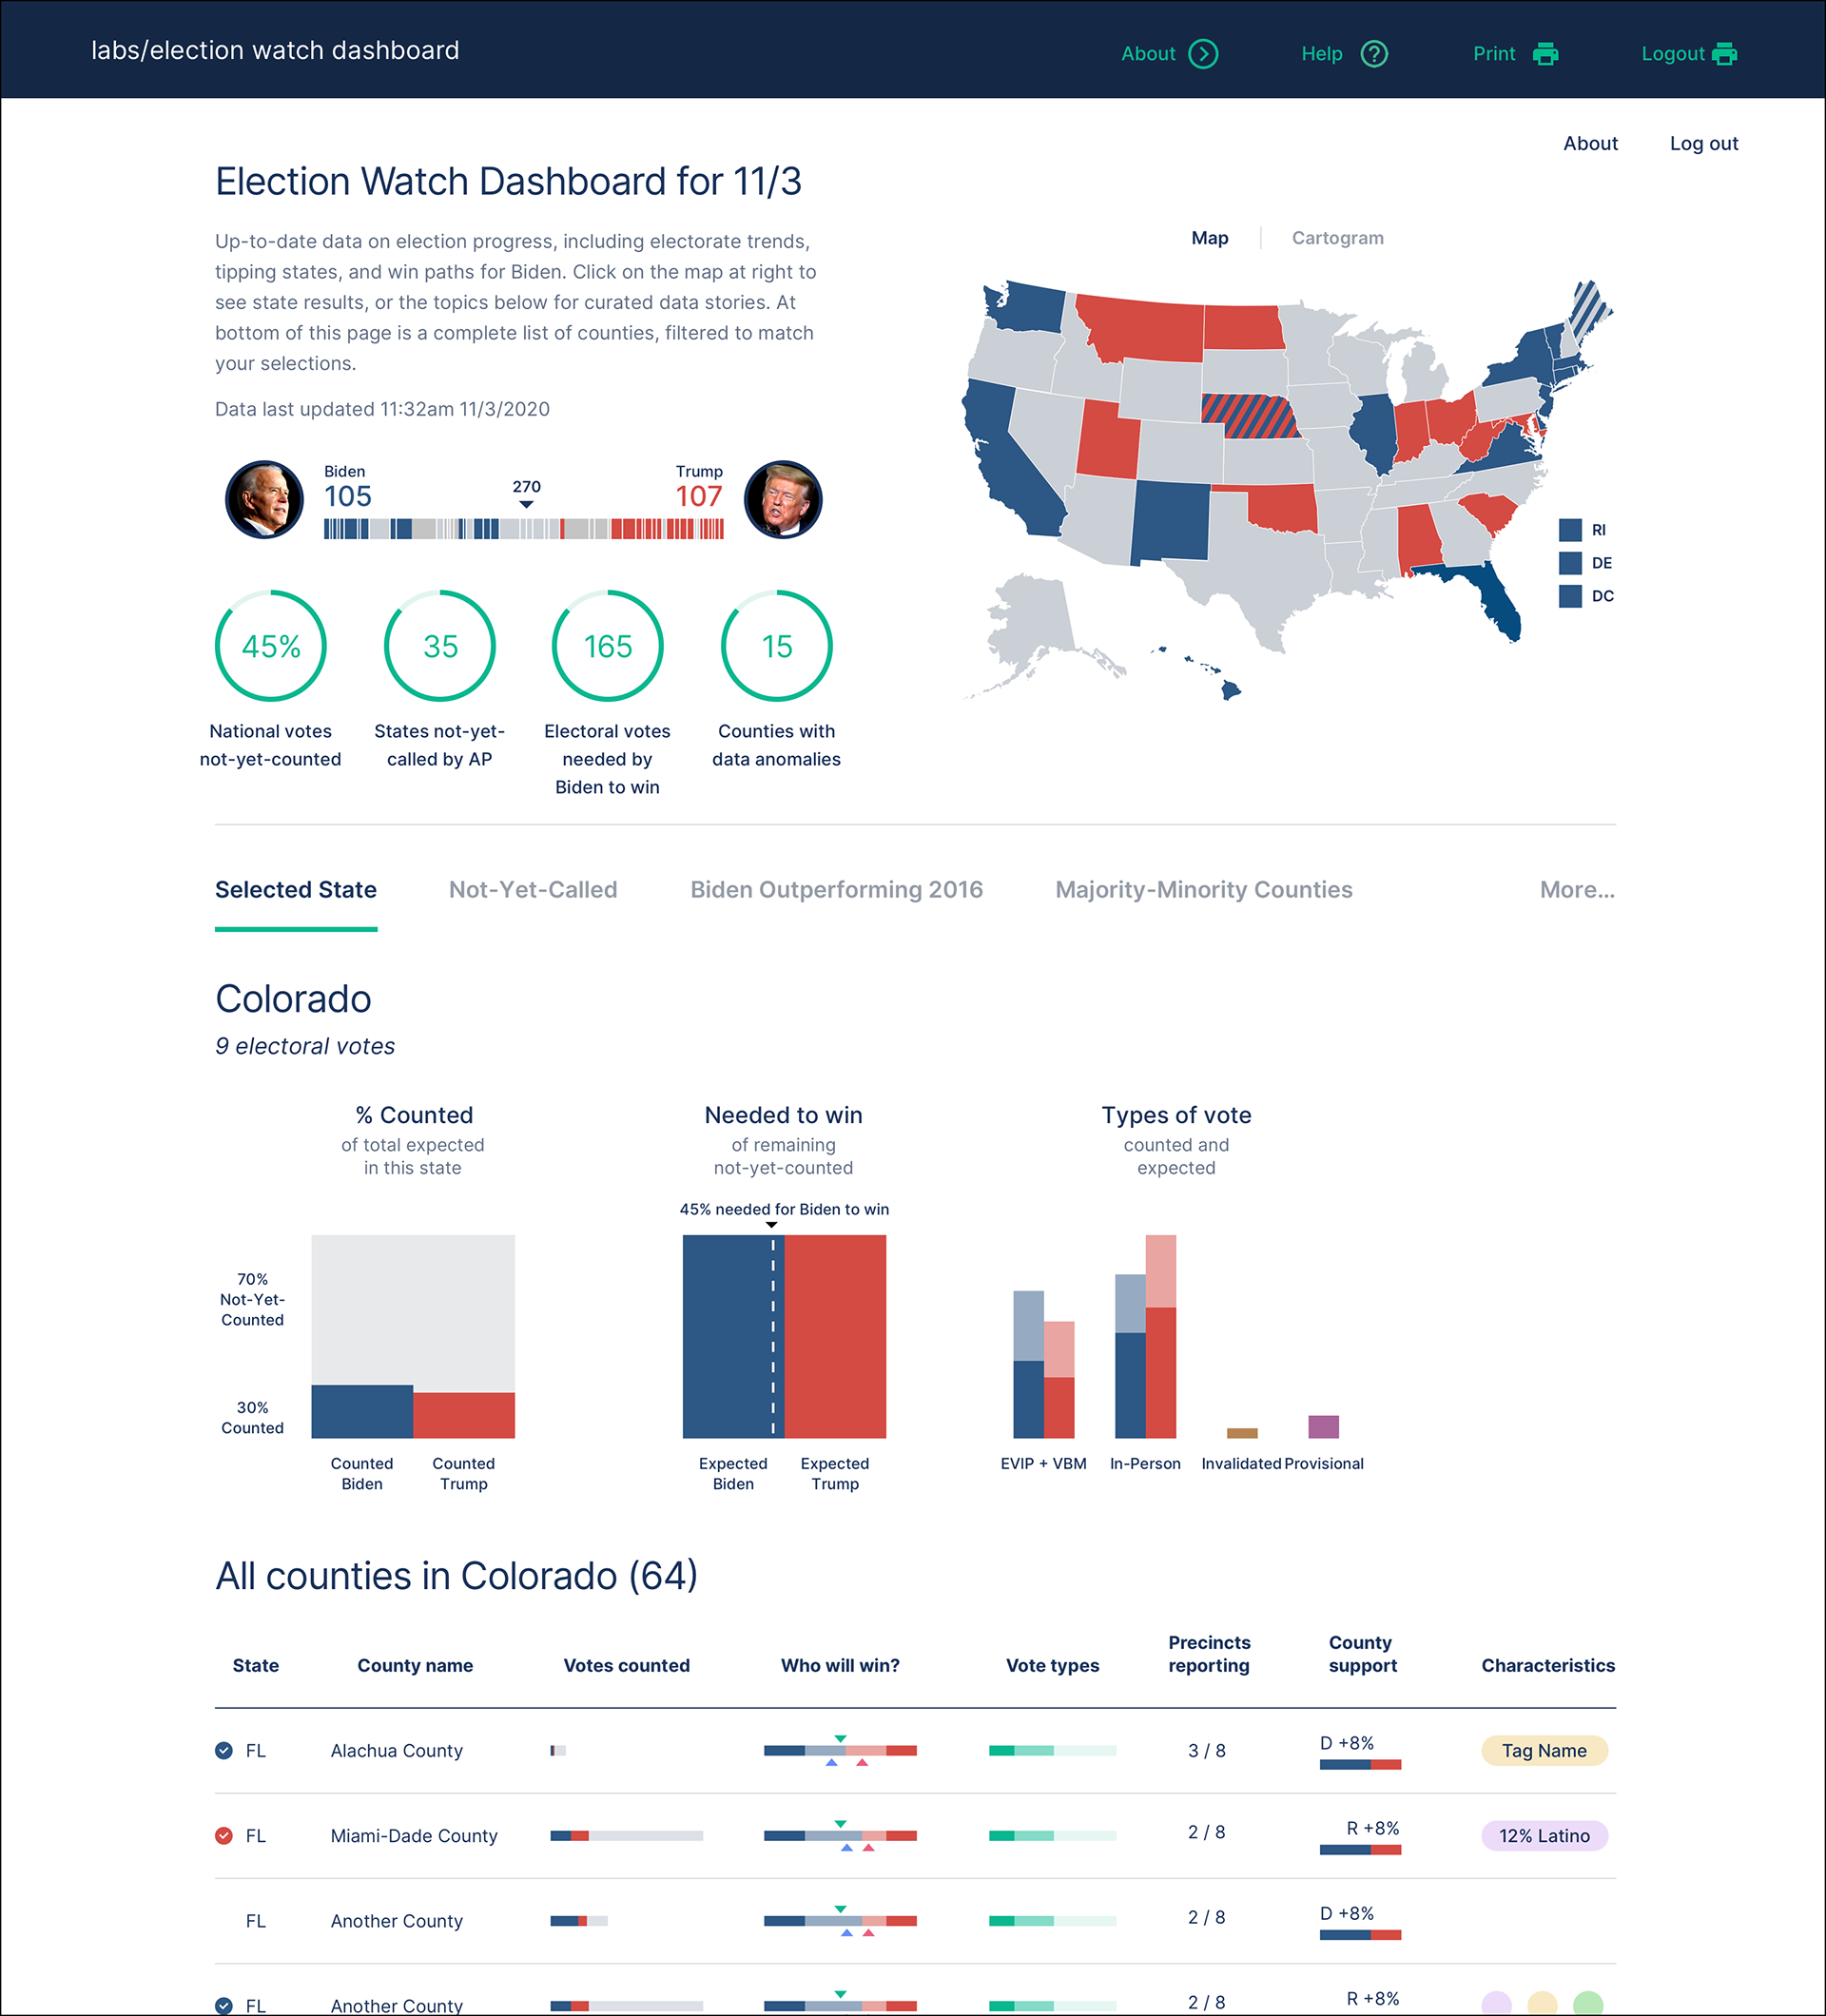
Election Dashboards
Reporting public and proprietary analytics for a turbulent election season, including uncertainties surrounding vote-by-mail.
Client: Hawkfish / Bloomberg
Client: Hawkfish / Bloomberg
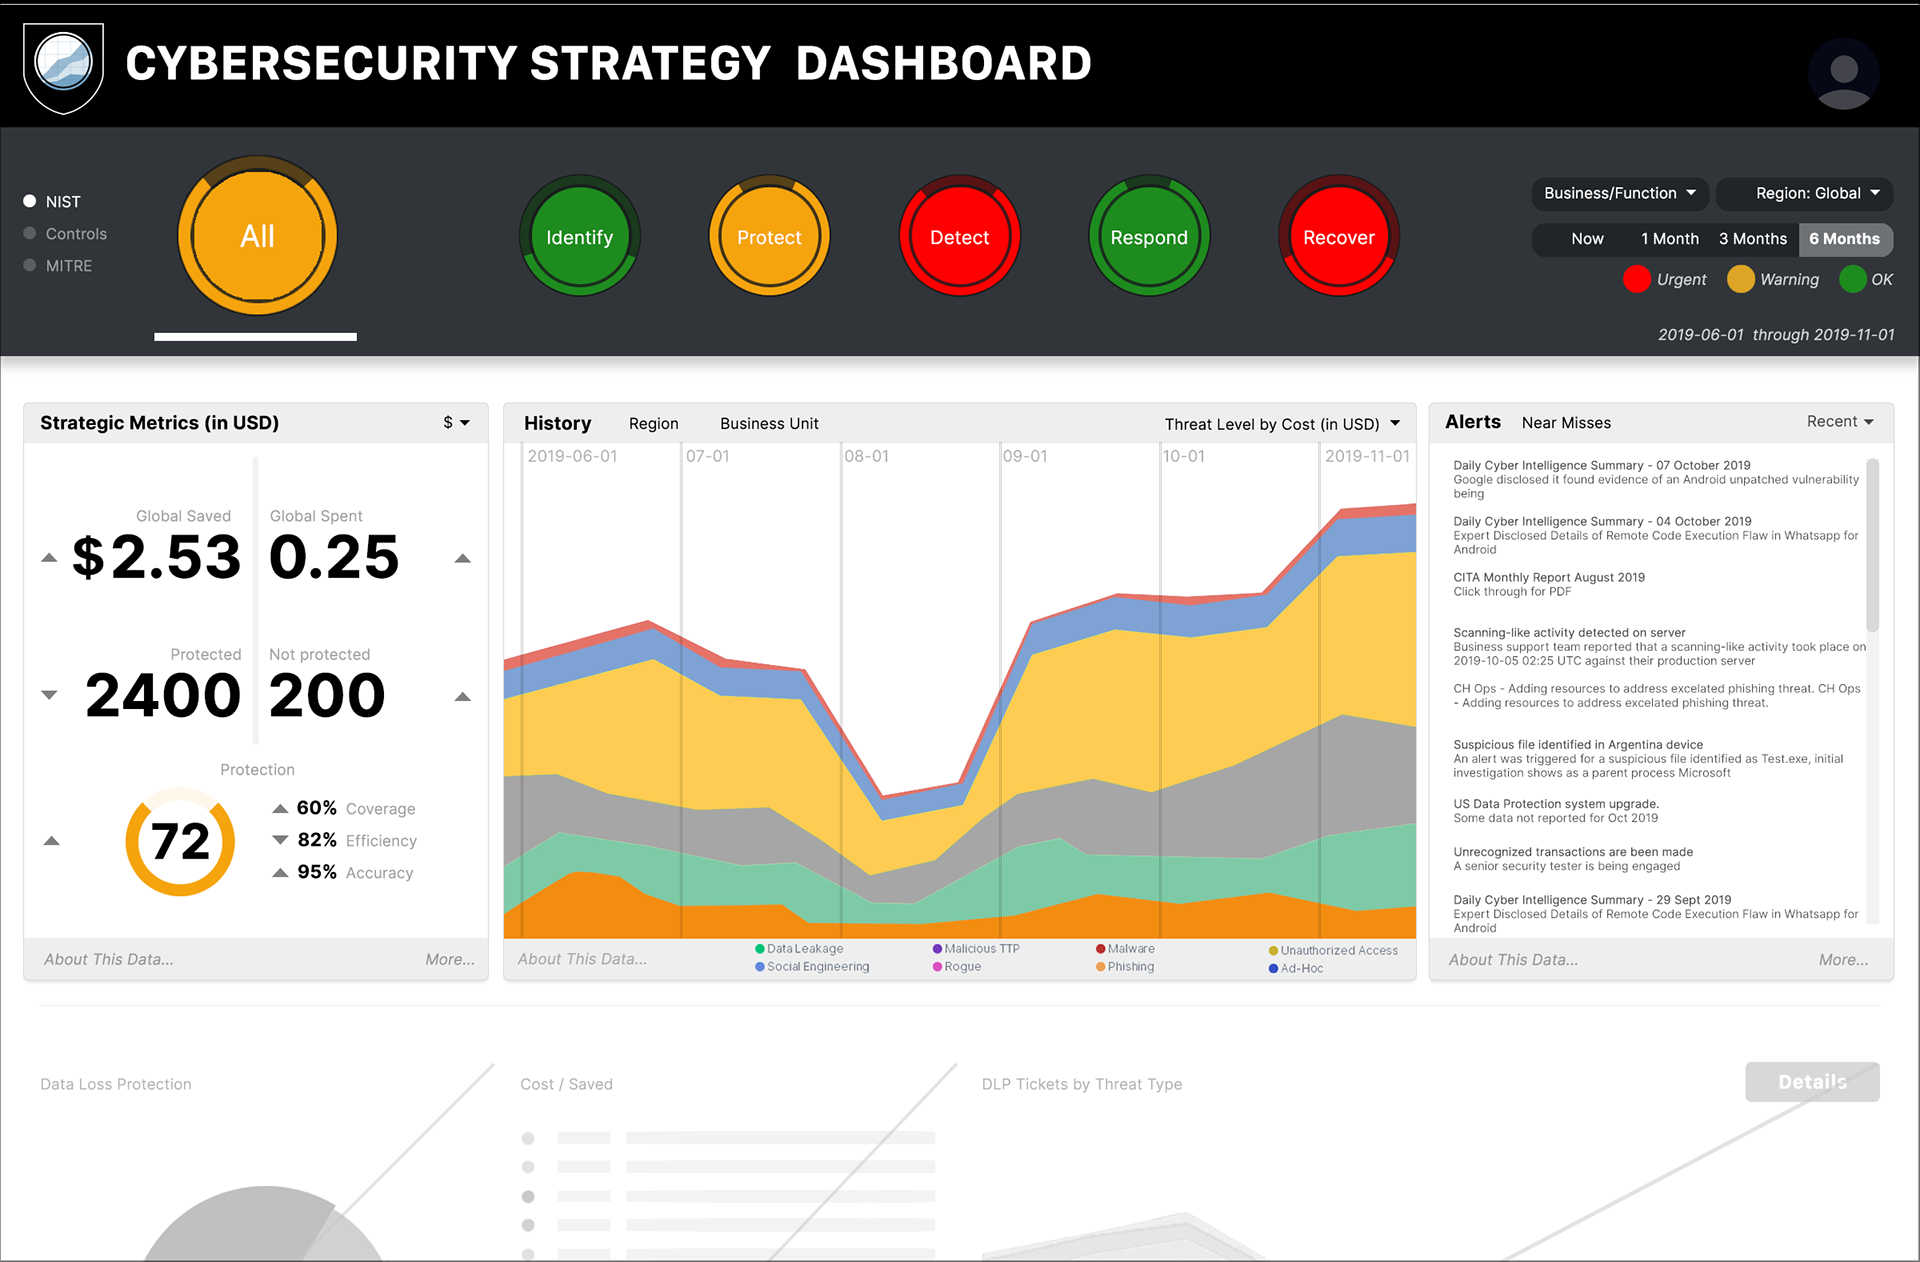
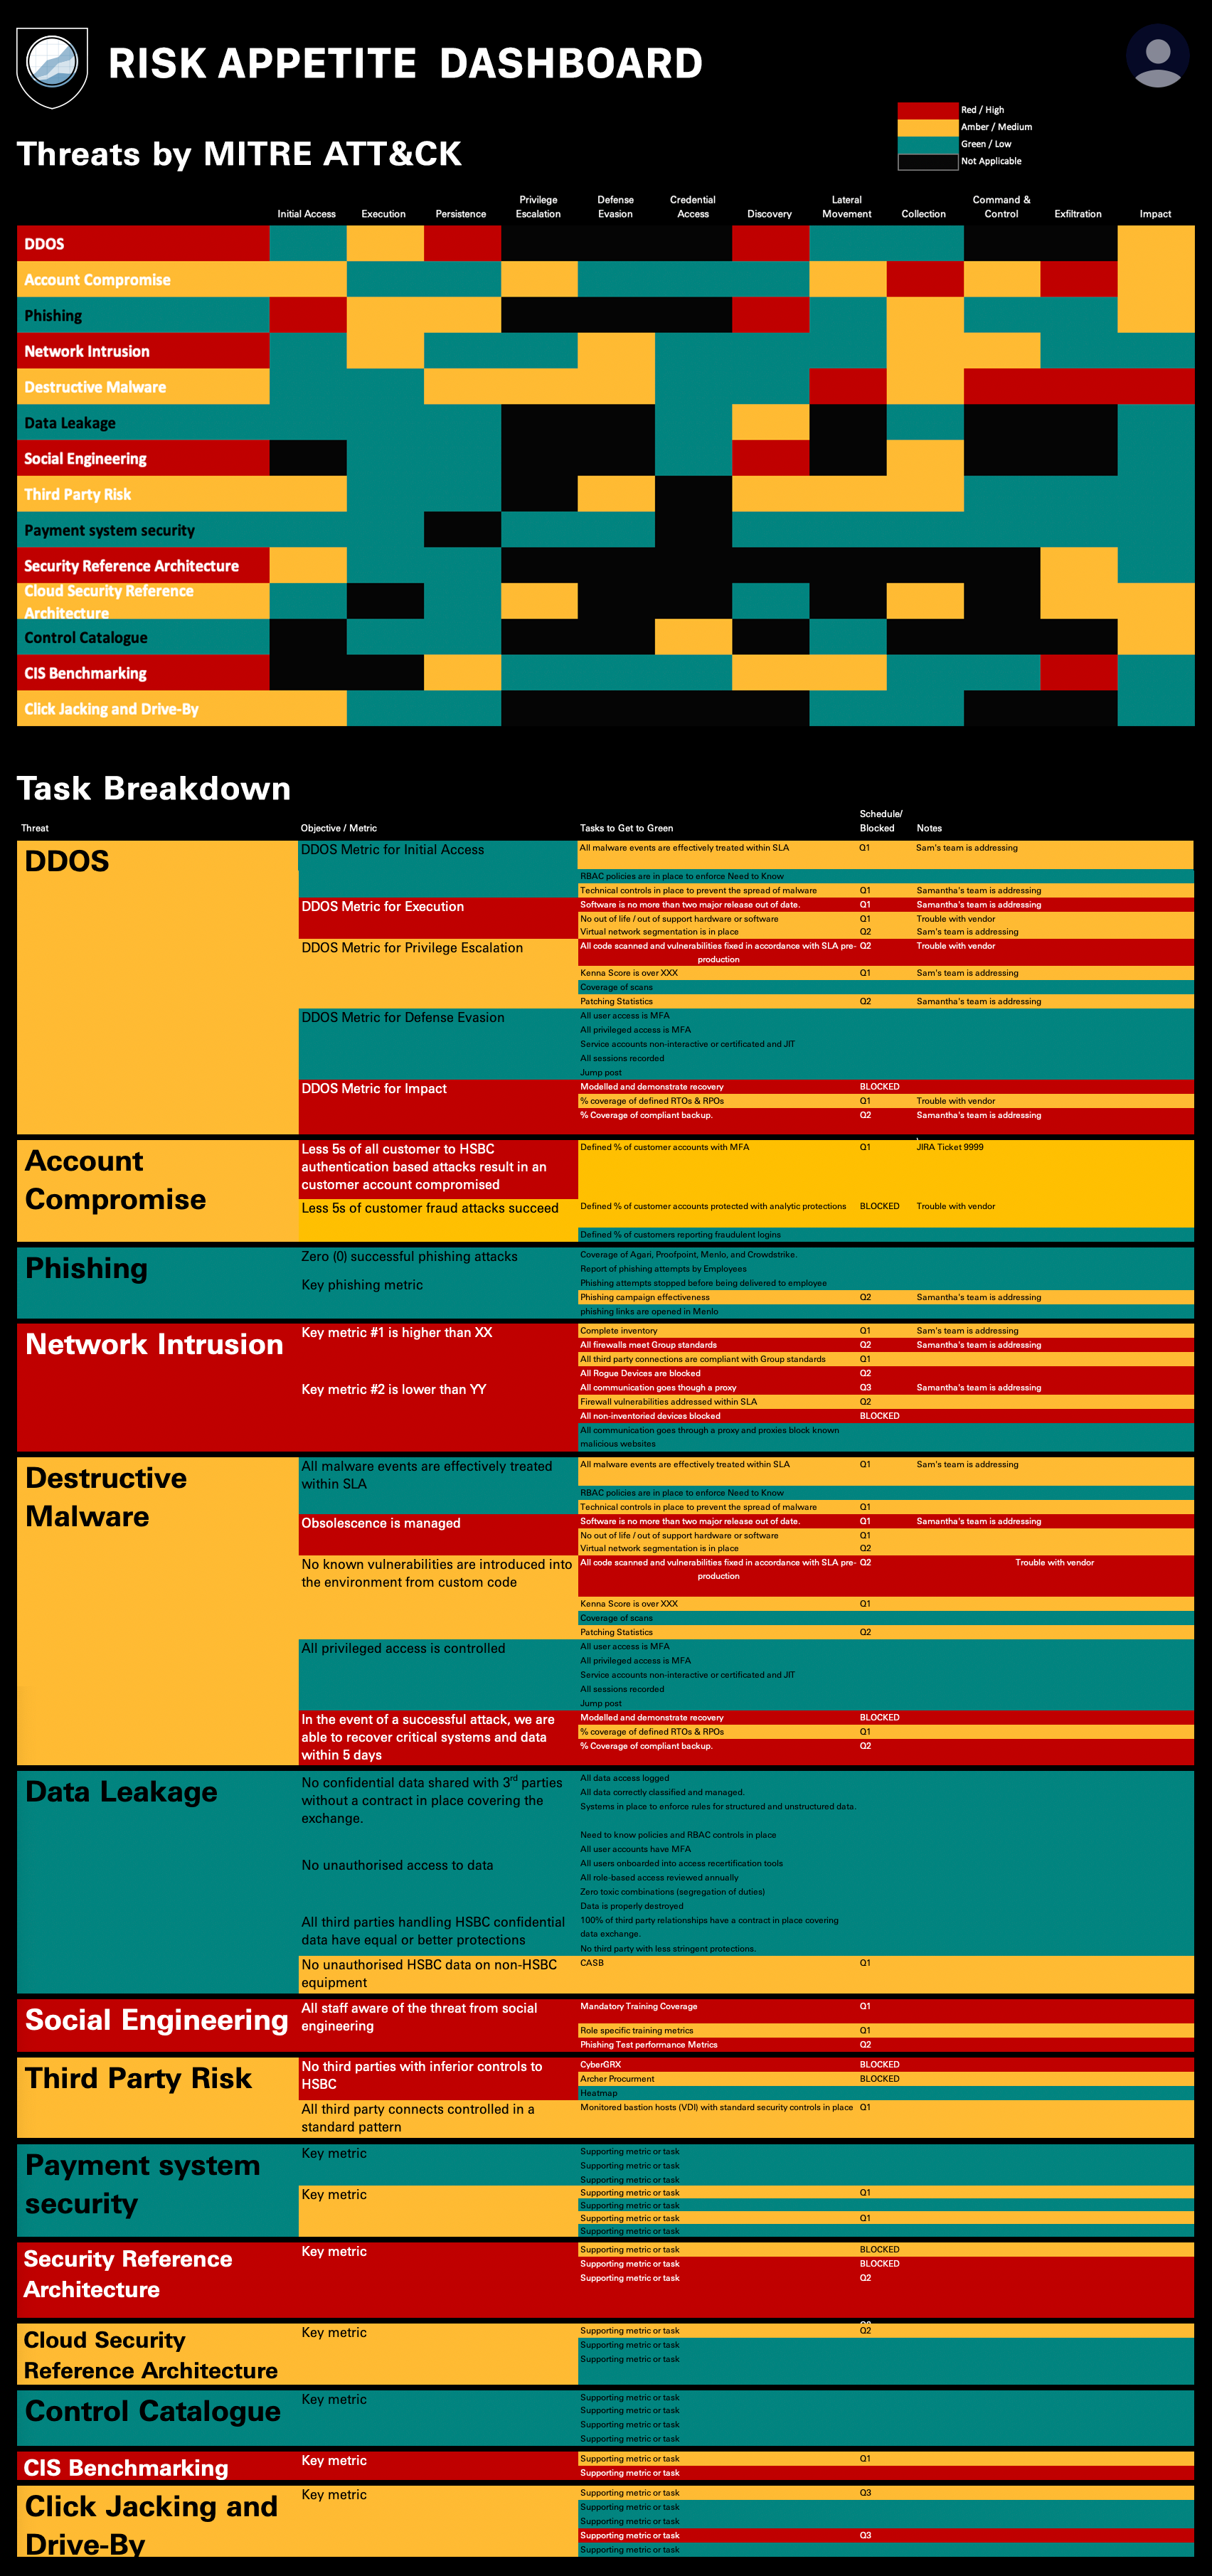
Defining Value in CyberSecurity Visualizations
Displaying rollups from a vast quantity of heterogenous data to ascertain risk and weigh priorities for a large global financial institution. Note Mockups show example data with fictional attack scenario.
Client: Under NDA
Client: Under NDA